contact@ffxf.net
 Console


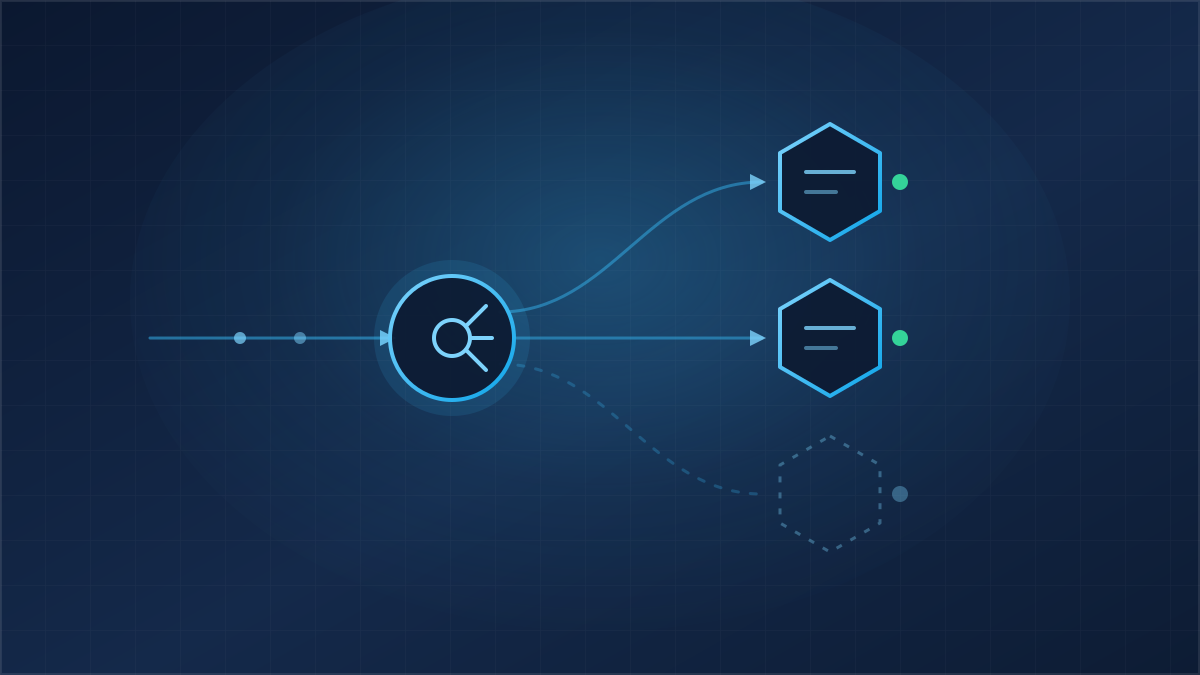
Two machines behind a load balancer is the usual recipe for a site that survives losing a server. What matters is what your visitors see during the outage: how many requests fail, how many are delayed, and how long the repaired machine takes to get its share of traffic back.
We built this setup on our own account, sent one request every 100 ms through real outages, and logged everything. The numbers below come from those logs. Our first round of measurements exposed a flaw in our load balancer; we fixed it, then ran everything again on a fresh load balancer. Section 8 tells the before and after. Setting up a load balancer is covered in Load balancer: one address, several VMs; here we break it.
1. The setup
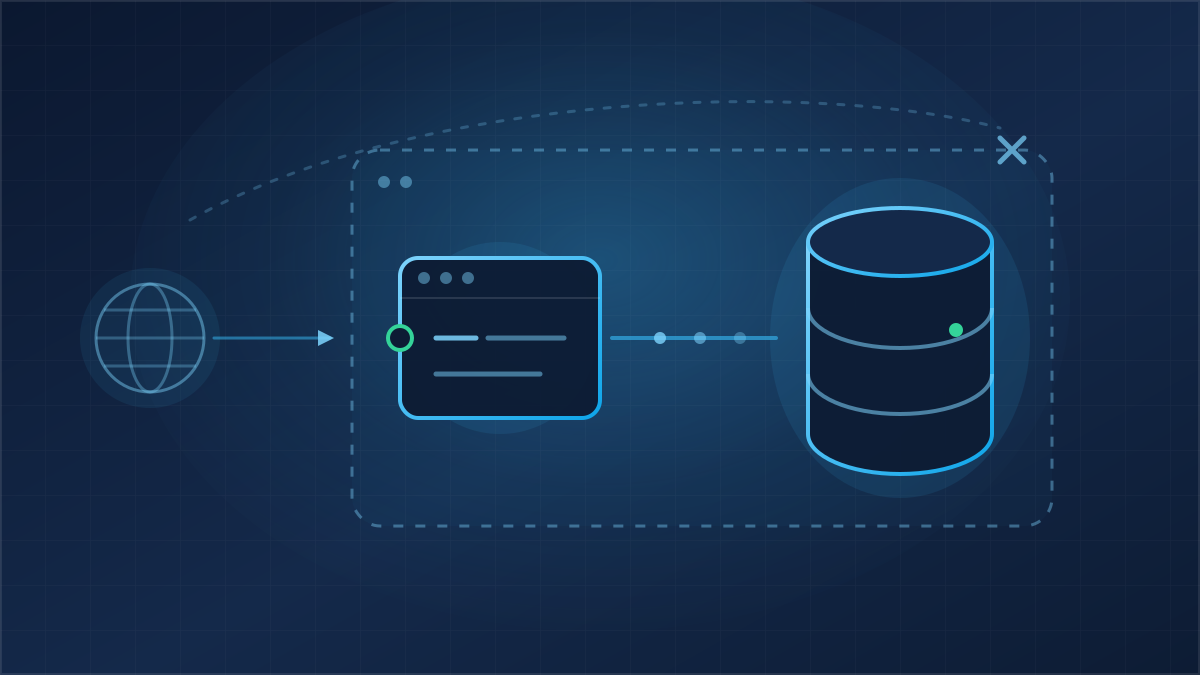
One private network, two IPv6-only Nano machines billed by the hour (1 vCPU, 2 GB), and a load balancer on the same network. The machines have no IPv4: the load balancer reaches them on their private addresses and holds the public address itself.
curl -s -X POST https://api.ffxf.net/v1/vms \
     -H "Authorization: Bearer $FFXF_TOKEN" -H "Idempotency-Key: $(uuidgen)" \
     -H "Content-Type: application/json" \
     -d '{"plan": "nano", "region": "montreal", "image": "debian-13",
          "hostname": "web-a", "billing": "hourly", "ipv4": false,
          "vpc": 44, "ssh_keys": ["34"], "password_delivery": "none"}'

curl -s -X POST https://api.ffxf.net/v1/load-balancers \
     -H "Authorization: Bearer $FFXF_TOKEN" -H "Idempotency-Key: $(uuidgen)" \
     -H "Content-Type: application/json" \
     -d '{"name": "ha-demo", "vpc": 44}'
The second machine is ordered the same way as web-b. In our latest
run both Nanos were running less than 40 seconds after the order, and the load
balancer went from pending to active in just under three
minutes. Then an HTTP pool whose health check requests /health, both
targets on port 8080, and an HTTP listener on port 80:
curl -s -X POST https://api.ffxf.net/v1/load-balancers/10/pools \
     -H "Authorization: Bearer $FFXF_TOKEN" -H "Content-Type: application/json" \
     -d '{"name": "web", "protocol": "http", "health_type": "http", "health_path": "/health"}'

curl -s -X PUT https://api.ffxf.net/v1/load-balancers/10/pools/14/targets \
     -H "Authorization: Bearer $FFXF_TOKEN" -H "Content-Type: application/json" \
     -d '{"targets": [{"vm": 322, "port": 8080}, {"vm": 326, "port": 8080}]}'

curl -s -X POST https://api.ffxf.net/v1/load-balancers/10/listeners \
     -H "Authorization: Bearer $FFXF_TOKEN" -H "Content-Type: application/json" \
     -d '{"port": 80, "protocol": "http", "default_pool": 14}'
One catch: a target must already be a member of the load balancer's private
network. While a machine is still being built, the API rejects the list with
This machine is not in the load balancer's private network.
Replaying the same PUT once the machine is running fixes it.
2. An app that says who answered
Each machine runs a small Python server that answers servi par
followed by its hostname, and ok on /health. It runs as
a systemd service, enabled at boot:
import socket
from http.server import ThreadingHTTPServer, BaseHTTPRequestHandler

NAME = socket.gethostname()

class H(BaseHTTPRequestHandler):
    def do_GET(self):
        body = b"ok\n" if self.path == "/health" else f"servi par {NAME}\n".encode()
        self.send_response(200)
        self.send_header("Content-Type", "text/plain")
        self.send_header("Content-Length", str(len(body)))
        self.end_headers()
        self.wfile.write(body)

ThreadingHTTPServer(("0.0.0.0", 8080), H).serve_forever()$ for i in 1 2 3 4; do curl -s http://203.0.113.83/; done
servi par blog-08b-a
servi par blog-08b-b
servi par blog-08b-a
servi par blog-08b-b
This /health only proves the process is alive. In a real application
it should check what the page needs (database, disk); otherwise the load balancer
keeps sending traffic to a machine that answers, just badly.
3. The probe: one request every 100 ms
The test client runs on a machine in our Montreal network. It fires one request
every 100 ms, each in its own thread so a stuck request does not delay the next
ones, and records start time, duration and response. It waits up to 60 seconds
before giving up. Normally a request takes 3 to 9 ms and responses alternate
strictly between the two machines. Meanwhile a second script polls
GET /load-balancers/10 every 3 seconds to log the health state the
load balancer reports.
4. Outage 1: the VM loses power
The stop action cuts the machine's power, like pulling the plug:
curl -s -X POST https://api.ffxf.net/v1/vms/326/actions \
     -H "Authorization: Bearer $FFXF_TOKEN" -H "Content-Type: application/json" \
     -d '{"type": "stop"}'
Result with the default health check (every 5 seconds): no failed requests. The 7 requests sent in the 1.2 seconds after the power cut were served by the other machine, one second late (1,004 to 1,005 ms instead of 5). Every request after that went straight to the healthy machine in a few milliseconds.
What happens: a powered-off machine does not refuse connections, it just stops
answering. The load balancer gives up on the connection after one second and
sends the request to the other target. After a few connection failures in a row
it pulls the machine from the pool without waiting for the health check. The API
showed the target as down about 9 seconds after the power cut, long
after traffic had stopped going to it.
5. Outage 2: the service dies, the VM stays up
sudo systemctl stop webappThe machine stays on, but nothing listens on port 8080 anymore, so connections are refused immediately. No failed requests; a single one was delayed by one second and then served by the other machine.
6. Restart and reintegration
A returning machine must pass two checks in a row before it gets traffic again. Measured from the command to its first served response, with the 5-second check:
- after an API
startof a powered-off machine: 24.6 seconds, Debian boot included; - after
systemctl start webapp: 4.9 seconds; - no failed requests during reintegration: the machine only rejoins the pool once it is ready.
A quick reboot through the API with no precaution was the worst case
in our first round. This time the machine was gone for 23 seconds and a single
request was delayed by one second. No failures.
7. Health checks every 2 seconds
The check interval is set per pool, from 2 to 60 seconds:
curl -s -X PATCH https://api.ffxf.net/v1/load-balancers/10/pools/14 \
     -H "Authorization: Bearer $FFXF_TOKEN" -H "Content-Type: application/json" \
     -d '{"health_interval": 2}'
Same outages, same machines:
| Situation | Check every 5 s | Check every 2 s |
|---|---|---|
VM powered off (stop) | 0 failures, 7 requests at ~1 s | 0 failures, 8 requests at ~1 s |
| Web service stopped | 0 failures, 1 request at ~1 s | 0 failures, 1 request at ~1 s |
reboot without draining | 0 failures, 1 request at ~1 s | 0 failures, 1 request at ~1 s |
reboot after draining | 0 failures, max 11 ms | 0 failures, max 8 ms |
Back after start | 24.6 s | 16.8 s |
| Service back | 4.9 s | 1.8 s |
| Back after draining ends | 3.9 s | 1.7 s |
When a machine dies, the interval no longer makes a difference: traffic leaves the
target on the first failed connection, well before the next check. It only
affects how fast a machine comes back, by a few seconds. The cost is 2.5 times as
many /health requests per target, which is nothing for a light check
but can matter if /health queries a database. The 5-second default is
fine for most sites. Over the hour of both runs, the load balancer's own
statistics counted 7,136 requests, all 2xx, no 5xx.
8. Our first measurement, on November 3
The same test sequence, on a load balancer created on the morning of November 3, told a very different story:
| Situation (5 s check) | First measurement | Now |
|---|---|---|
| VM powered off | 139 and 145 failures over 27.6 and 28.8 s, each 503 after 20 s | 0 failures |
| Web service stopped | 69 failures over 13.6 s, each 503 after 3 s | 0 failures |
reboot without draining | 54 failures and 37 requests delayed by 1 to 9 s | 0 failures |
| VM powered off, 2 s check | 56 failures over 11.0 s | 0 failures |
The cause was in the configuration our load balancer generates. A request sent to a dead machine stayed stuck there: a 5-second connection timeout, three more attempts on the same target, then a 503. Until the health check removed the machine, its half of the traffic failed, slowly. We changed three things: the connection timeout is now 1 second, a request whose connection fails is sent to another target, and three connection failures in a row are enough to take a target out of the pool without waiting for the health check. The numbers in sections 4 to 7 come from a brand-new load balancer created after that change.
9. Planned maintenance: drain anyway
The drained reboot ({"drain": true} on the target, wait,
reboot, {"drain": false}) had no failures and no delay: the slowest
request took 11 ms. Without draining, the only measured cost is one request
delayed by a second. The gap looks small, but our probe only sends requests that
last a few milliseconds. A request already being processed on the machine that
reboots (a file upload, a long report) is not moved elsewhere: only failed
connections are. Draining lets those requests finish.
One detail: the drained machine still received traffic for 7 and 9 seconds after
the command, several seconds after the API reported
config_applied. Wait about ten seconds before rebooting.
10. What the setup costs
| Item | Hourly | Full month, hourly | Monthly plan |
|---|---|---|---|
| 2 IPv6-only Nano | 2 × 0.014 CAD | 20.44 CAD | 2 × 6.50 CAD = 13 CAD |
| Load balancer | 0.010 CAD | 7.30 CAD | 7.30 CAD |
| Total | 0.038 CAD | 27.74 CAD | 20.30 CAD |
The private network is free. Traffic through the load balancer counts against the target machines, within their 1 TB monthly allowance. A single Nano on a monthly plan costs 6.50 CAD, so redundancy adds 13.80 CAD a month. A machine that is powered off but kept still costs 0.003 CAD an hour. Each test round, from creation to deletion, cost less than 0.06 CAD.
11. Takeaways
- With two machines behind our load balancer, losing one of them failed no requests: at worst, a one-second delay for the requests that hit the lost machine.
- The target is pulled on the first failed connection, not by the health check. The 5-second default is enough; 2 seconds only speeds up a machine's return.
- For maintenance, drain first and wait about ten seconds: no delay measured, and long requests get time to finish.
- A request already in progress on a machine that dies is still lost. A client retry on requests without side effects covers that case.
- A load balancer spreads requests, not data. Sessions, uploads and the database must live somewhere other than one of the two machines.
The API calls are covered in the load balancer documentation, and the network between the machines in the private networks documentation.